Lot No. LOT-1846 · offered October 9, 2026
Seeds, Crop Protection & FertilizerLot sheet
KTEN report pins fertilizer price swings on Iran War
KTEN attributes recent roller-coaster fertilizer prices to the Iran War, shifting blame from domestic supply to Middle East geopolitics. The report lacks specific dollar figures or methodology.
Market notes
- KTEN published a report blaming the Iran War for "roller coaster" fertilizer prices in its Texoma coverage area
- Iran holds one of the world's largest natural-gas reserves and operates major urea export terminals on the Persian Gulf
- The report does not include specific dollar figures, percentage changes, or a defined reporting window
- Nitrogen fertilizer retail prices in Texas and Oklahoma follow global urea and natural-gas benchmarks plus barge and trucking basis
- A $40 to $80 per ton swing in dealer nitrogen quotes can materially shift break-even price calculations on a 200-bushel corn budget
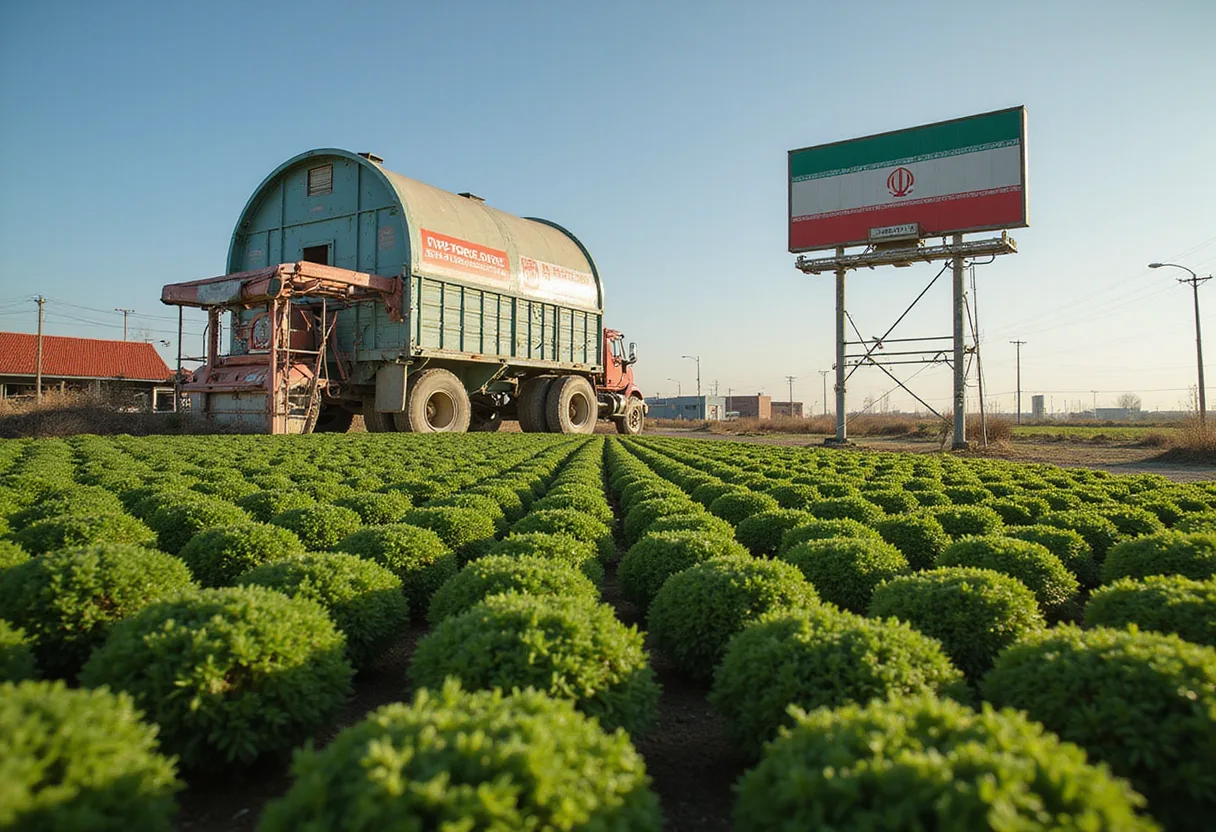
Fertilizer volatility traces to Middle East conflict, KTEN says
A KTEN report published this week puts the Iran War at the center of fertilizer price swings, characterizing quotes at farm-supply dealers as a "roller coaster" tied to events half a world away rather than to domestic production.
The broadcaster's framing shifts the explanation for input-cost turbulence away from weather, logistics, or U.S. plant outages and toward the military confrontation involving Iran, a country that sits on a major share of the world's urea and natural-gas-based nitrogen capacity. KTEN did not publish a specific price series alongside the headline claim; the report attributes the volatile pattern to the conflict without disclosing the reporting window, methodology, or the dealers it surveyed.
Why an Iran shock hits a nitrogen tank in Texoma
Nitrogen fertilizer prices follow natural gas, the primary feedstock for ammonia and urea, more closely than they follow corn or wheat futures. Iran holds one of the largest natural-gas reserves globally and operates large urea export terminals on the Persian Gulf. When shipping through the Strait of Hormuz or Gulf of Aden is threatened — or when sanctions enforcement tightens in response to armed conflict — global urea benchmarks move within hours, and U.S. dealers revise posted prices accordingly.
The transmission to a grower's bill is direct: wholesale urea and UAN move on the world market, river terminals in the Gulf and Pacific Northwest import product that competes with domestic production, and retailers in Texas, Oklahoma, and surrounding states price off those landed costs plus barge and trucking basis. A war headline in the Middle East can therefore reset a fall prepay quote before a planter leaves the shed in spring.
What the headline claim does and does not establish
"Roller coaster" is a directional description, not a measurement. Without dollar figures, percentage changes, or a date range, the report tells readers prices have moved sharply in both directions but does not quantify the peak-to-trough spread, the share of products affected, or whether volatility has been concentrated in nitrogen or has spread to phosphate and potash. Phosphate benchmarks are tied to Moroccan, Chinese, and Russian export flows; potash follows Belarusian and Canadian shipments. A reader should not infer from a single headline that all three nutrients are moving in lockstep with the Iran conflict.
Independent benchmarks tracked through 2025 show nitrogen led the move, with urea and UAN reacting to natural-gas volatility and to sanctions-risk premiums, while phosphate and potash traded on their own supply narratives. KTEN's report, taken on its own, documents perception of volatility in its broadcast region rather than a measured index change.
Where growers feel the impact first
For row-crop operators in the Texoma coverage area — corn, cotton, wheat, and soybean acreage in Grayson, Cooke, Fannin, and adjacent counties — the practical exposure runs through fall-applied nitrogen for winter wheat and through spring prepay contracts on ammonia and UAN for the 2026 corn crop. A dealer quote that moves $40 to $80 per ton inside two weeks changes the per-acre nitrogen bill on a 200-bushel corn budget by a margin large enough to swing break-even price calculations, particularly when corn futures are simultaneously under pressure.
Dairy and forage operations in the same region, which rely on nitrogen for bermudagrass and small-grain silage, see the same retail quotes but have fewer substitution options because forage tonnage and quality are biologically tied to available nitrogen.
What to watch next
The forward question is whether the Iran conflict produces a sustained supply disruption or a series of short, tradable headlines. KTEN's report will warrant a second look when it pairs its volatility claim with a price series, identifies the dealers surveyed, and specifies the reporting window. Until then, growers planning 2026 prepay should treat the broadcaster's framing as a flag to lock in portions of nitrogen needs on dips rather than to assume a one-way move higher.
The next KTEN update on input costs will be the first test of whether the Iran War remains the dominant story or whether domestic gas prices, river logistics, and planting intentions reassert themselves as the primary drivers of the retail fertilizer market.
via Google News: Fertilizer markets (Source)
More from Olivia Hart
Show full bio
News editor covering technology and product news in Agribusiness coverage for industry professionals at Agribusiness Wire.
414 articles
Also in the yard
- farmdoc daily: Iran Conflict Is Pushing Up U.S. Fertilizer Costs
- Middle East Conflict Pushes Fertilizer Prices Up Ahead of Fall Application
- Iran Conflict Stirs Fertilizer Cost Fears Among US Farmers
- Fertilizer Prices Drop on US-Iran Peace Deal News
- Rabobank: Fertilizer prices ease from Iran-war peaks, margins still tight